Self-hosted monitoring for Laravel that speaks the same wire protocol as Laravel Nightwatch and the Sentry SDKs, so your app sends its telemetry to your own server without changing a line of code.
- Role
- Author
- Since
- November 2026
- Backend
- Rust, axum, tokio, ClickHouse, SQLite
- Frontend
- React Router 7 with server rendering
Application monitoring sees everything: request payloads, queries, user IDs, exceptions with their context. With a hosted service all of that leaves your server, so you either trust it or spend time redacting. darkluna keeps it home: one container next to ClickHouse, no plans and no quotas.
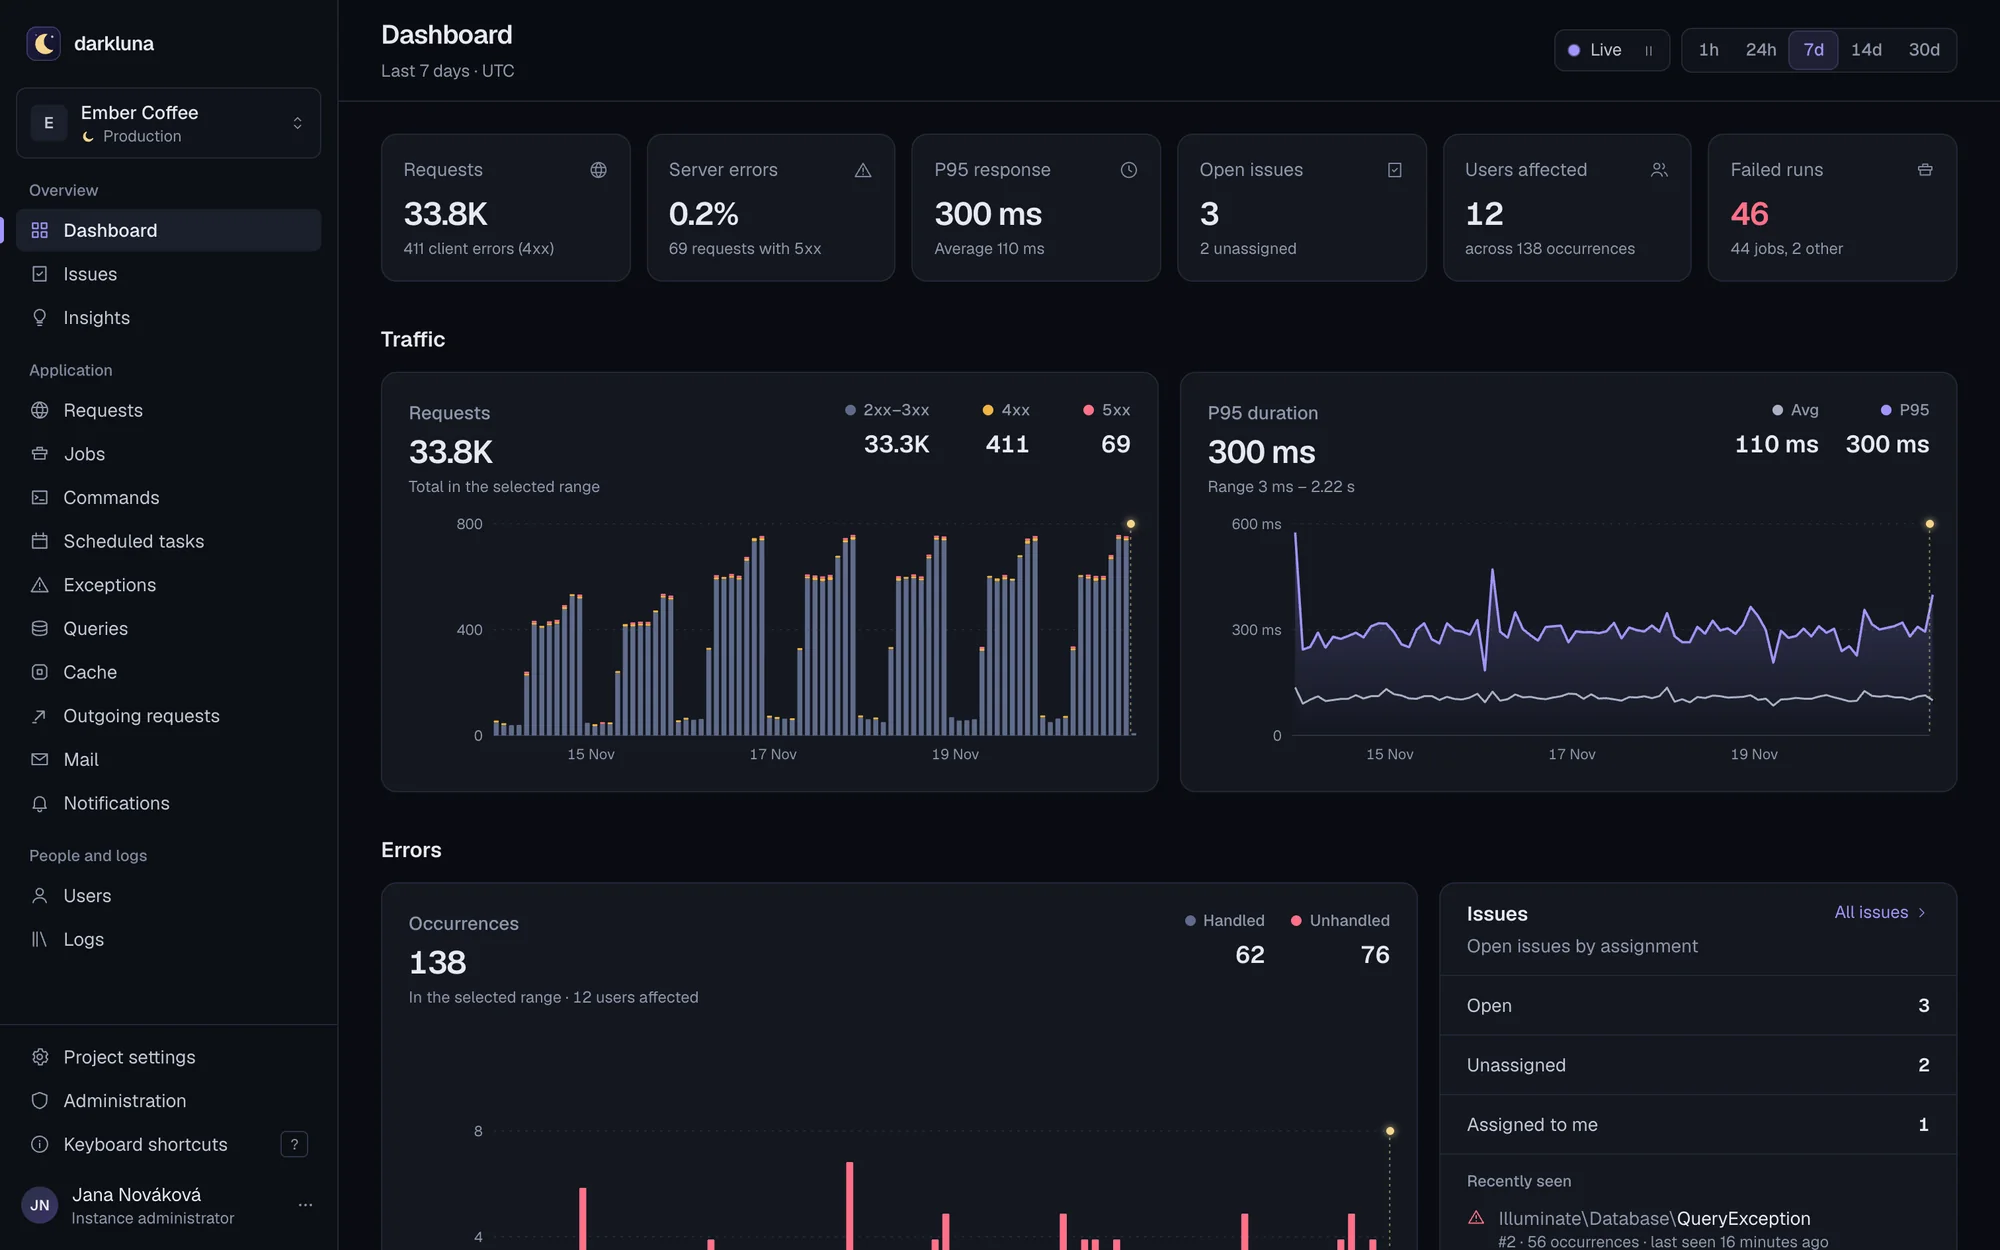
The Nightwatch package for Laravel is MIT licensed, so I read it, together with its bundled agent. The app does not talk to the cloud directly. At the end of every request or command it opens a TCP connection to a local agent and sends a small frame with a JSON array of records. The agent buffers, gzips and uploads.
<length>:v1:<tokenHash>:<body>    app to agent, one frame per connection
2:OK agent to app, then the socket closes01
Laravel app
Nightwatch or Sentry SDK, unchanged
02
Agent
PHP agent or darkluna agent, local TCP
03
darkluna
Rust ingest, bounded buffers
04
ClickHouse
Columnar storage with TTL
The consequence is the whole point: change NIGHTWATCH_BASE_URL and the token, and the original agent ships everything to darkluna instead. The Laravel app does not change.
- Requests, jobs, commands, scheduled tasks, queries, cache, outgoing HTTP, mail, notifications and logs, with totals, averages and p95
- Issues you triage: status, priority, assignee, comments and regressions
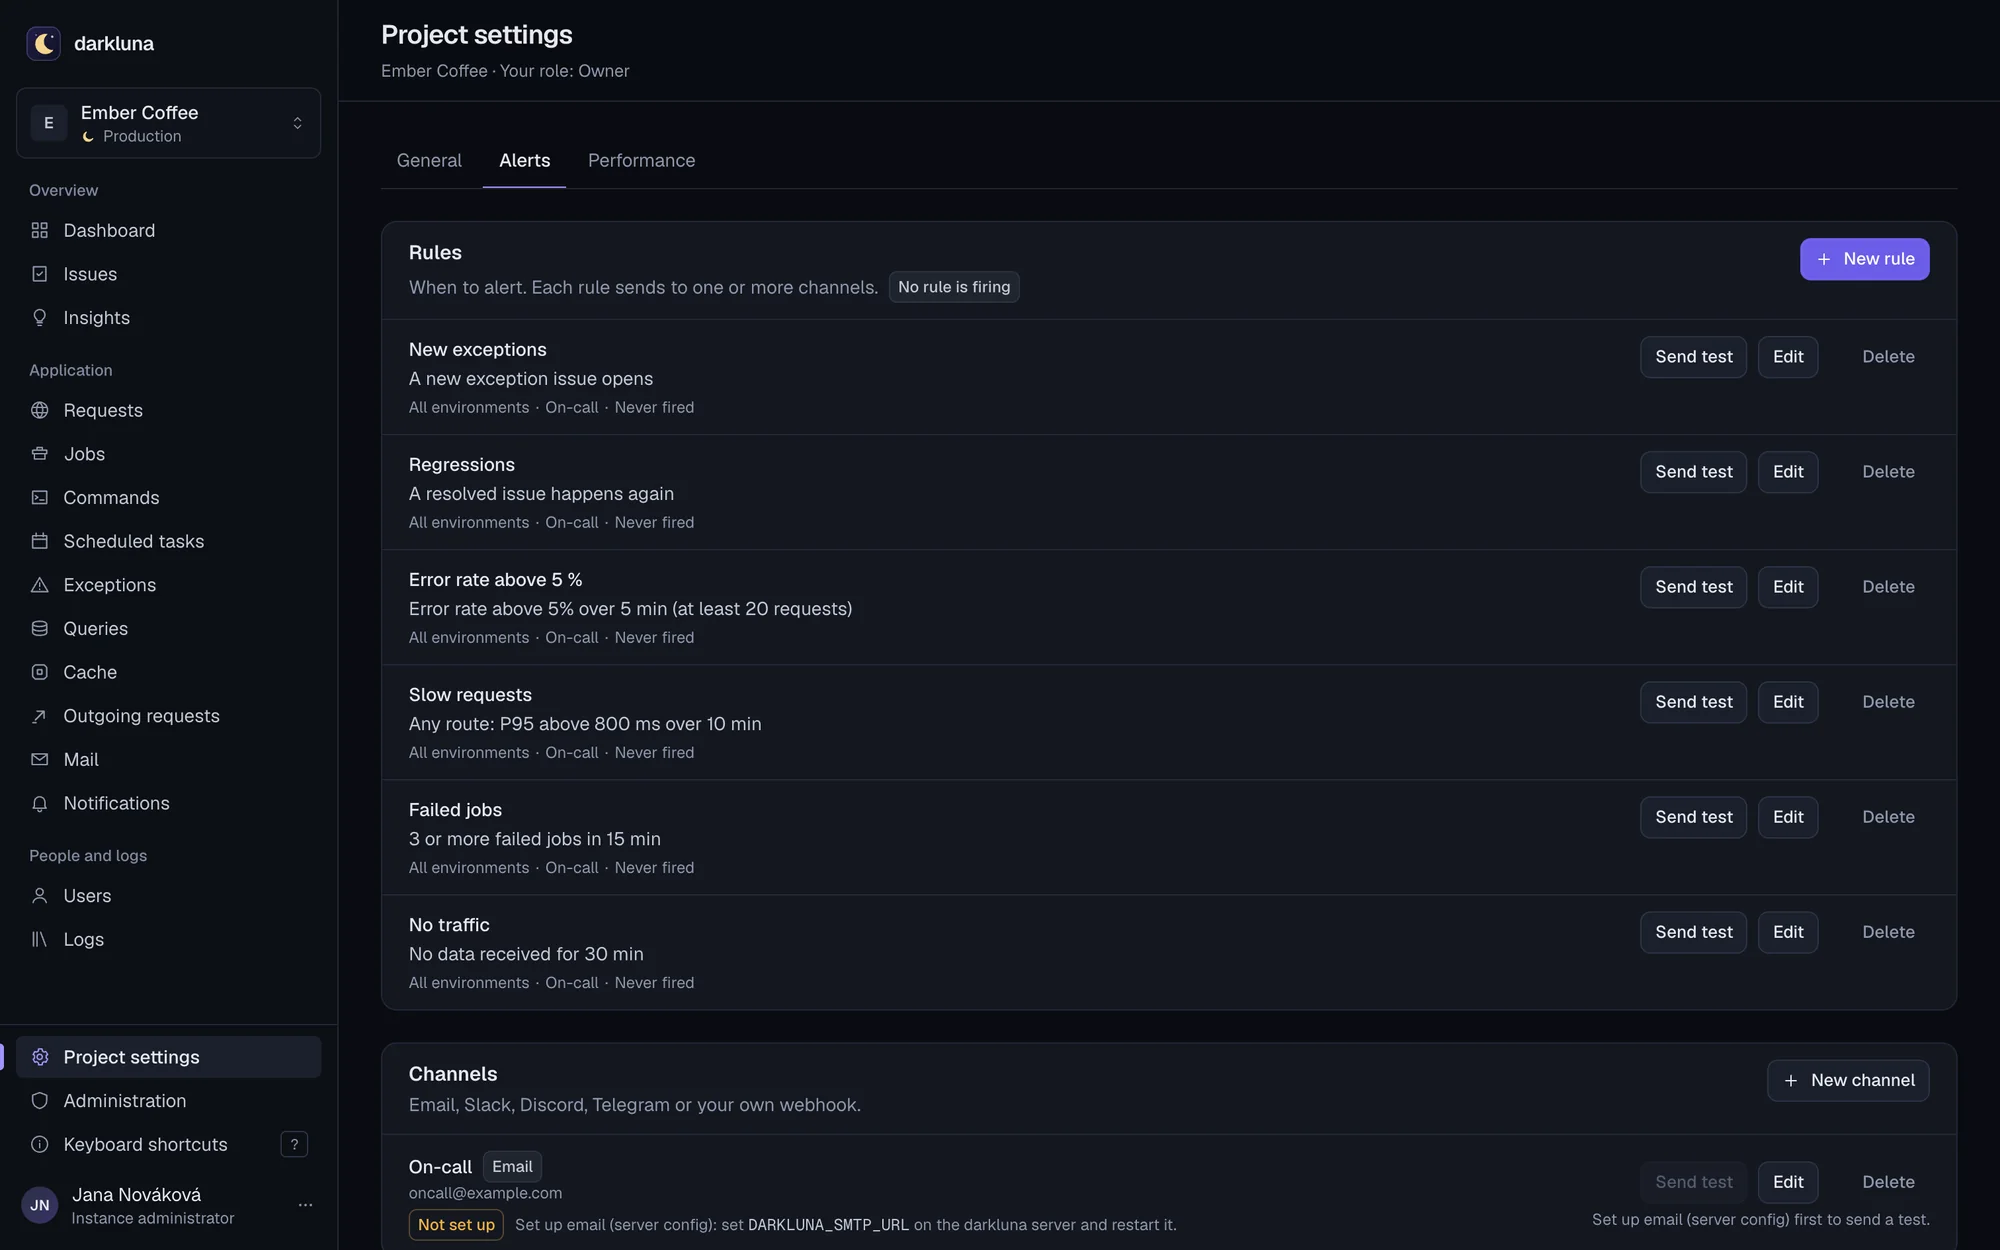
- Alerts to email, Slack, Discord, Telegram or a signed webhook, with cooldowns against flapping
- Performance issues when a route, job or command crosses its p95 threshold
- N+1 queries and lazy loading, worst first
- Live updates over a WebSocket and an MCP server so an AI assistant can read issues with your access
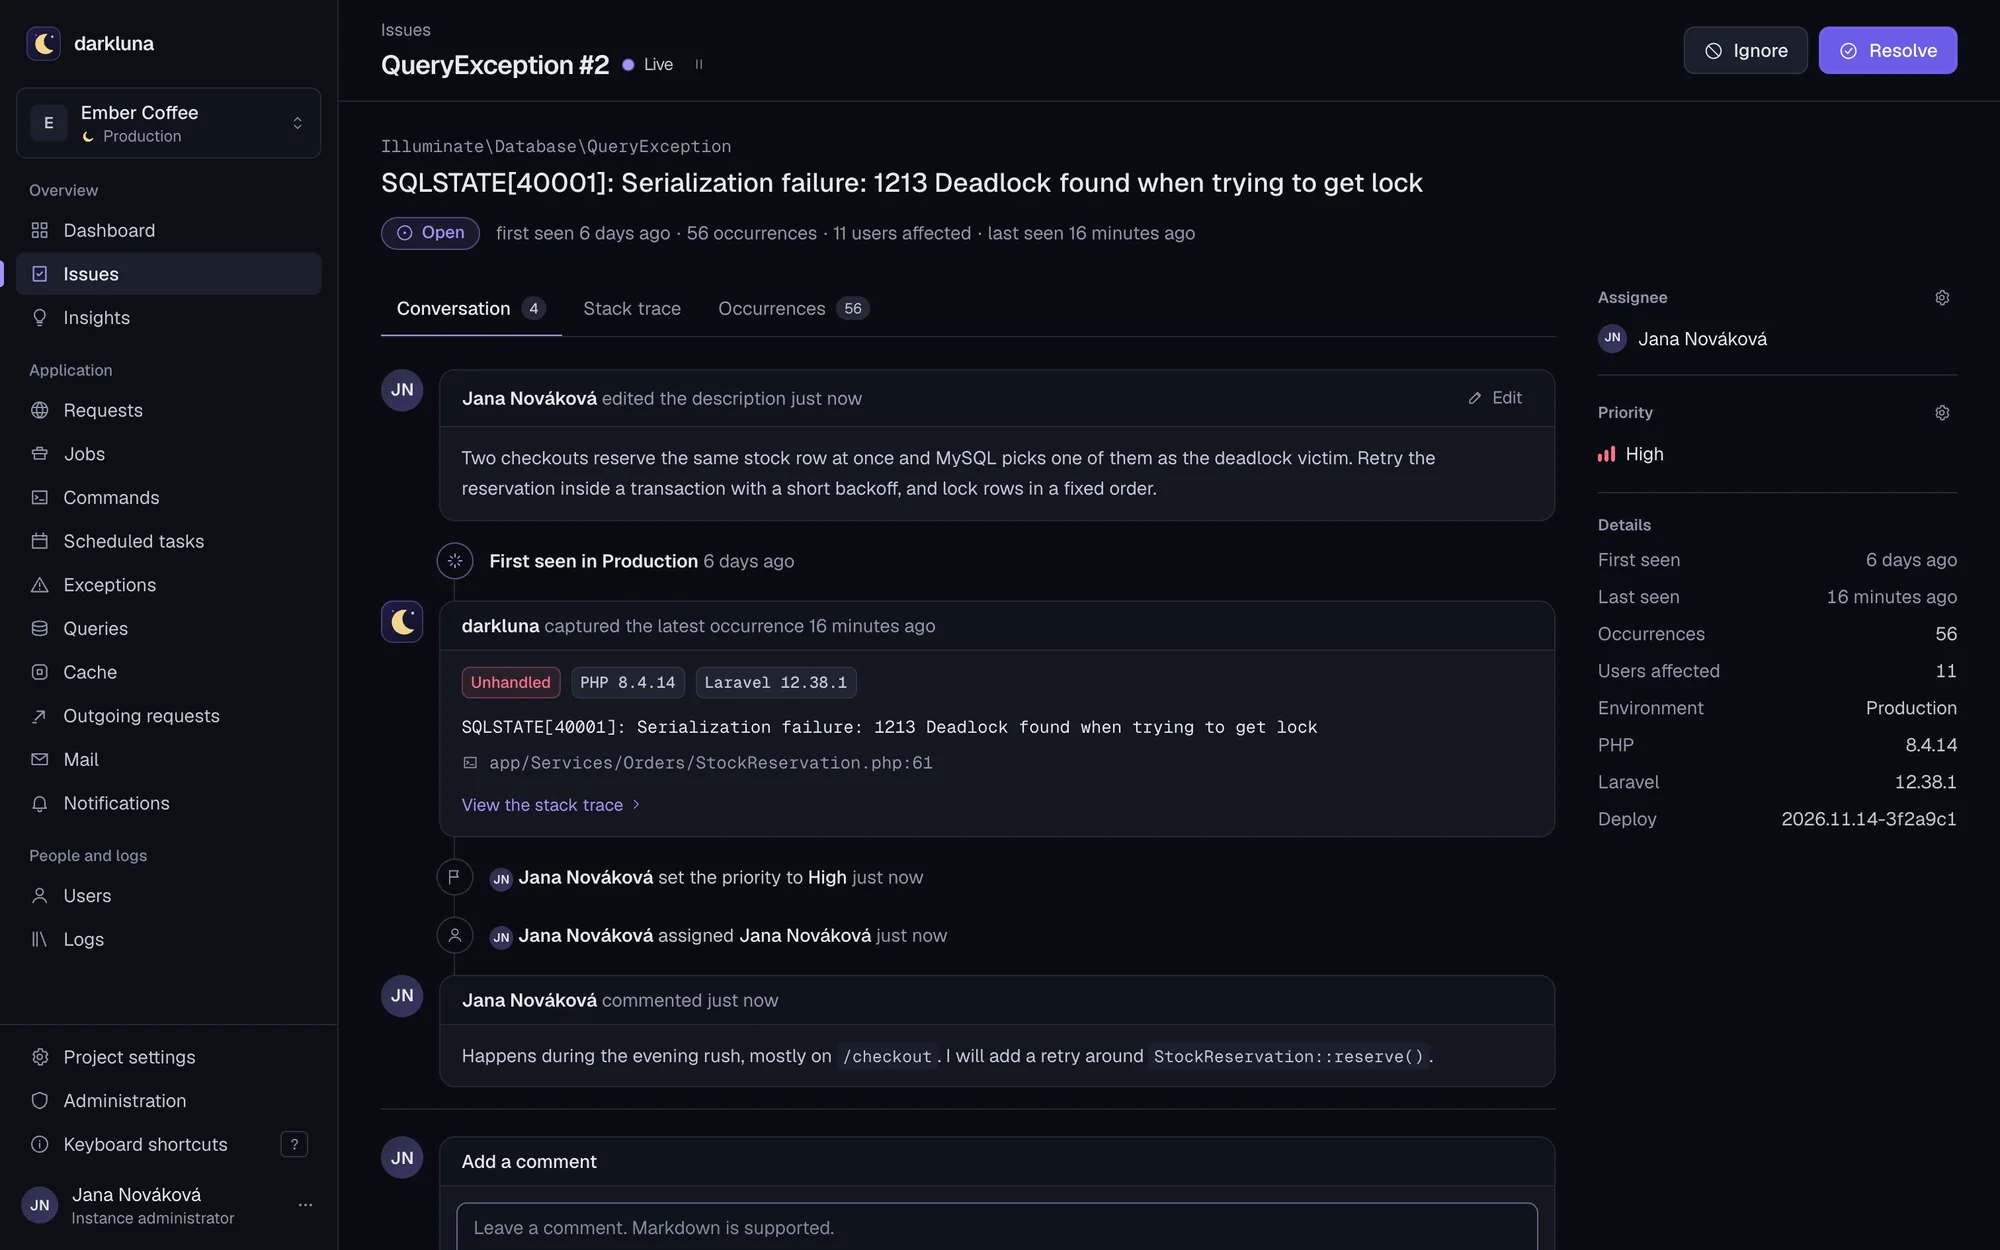
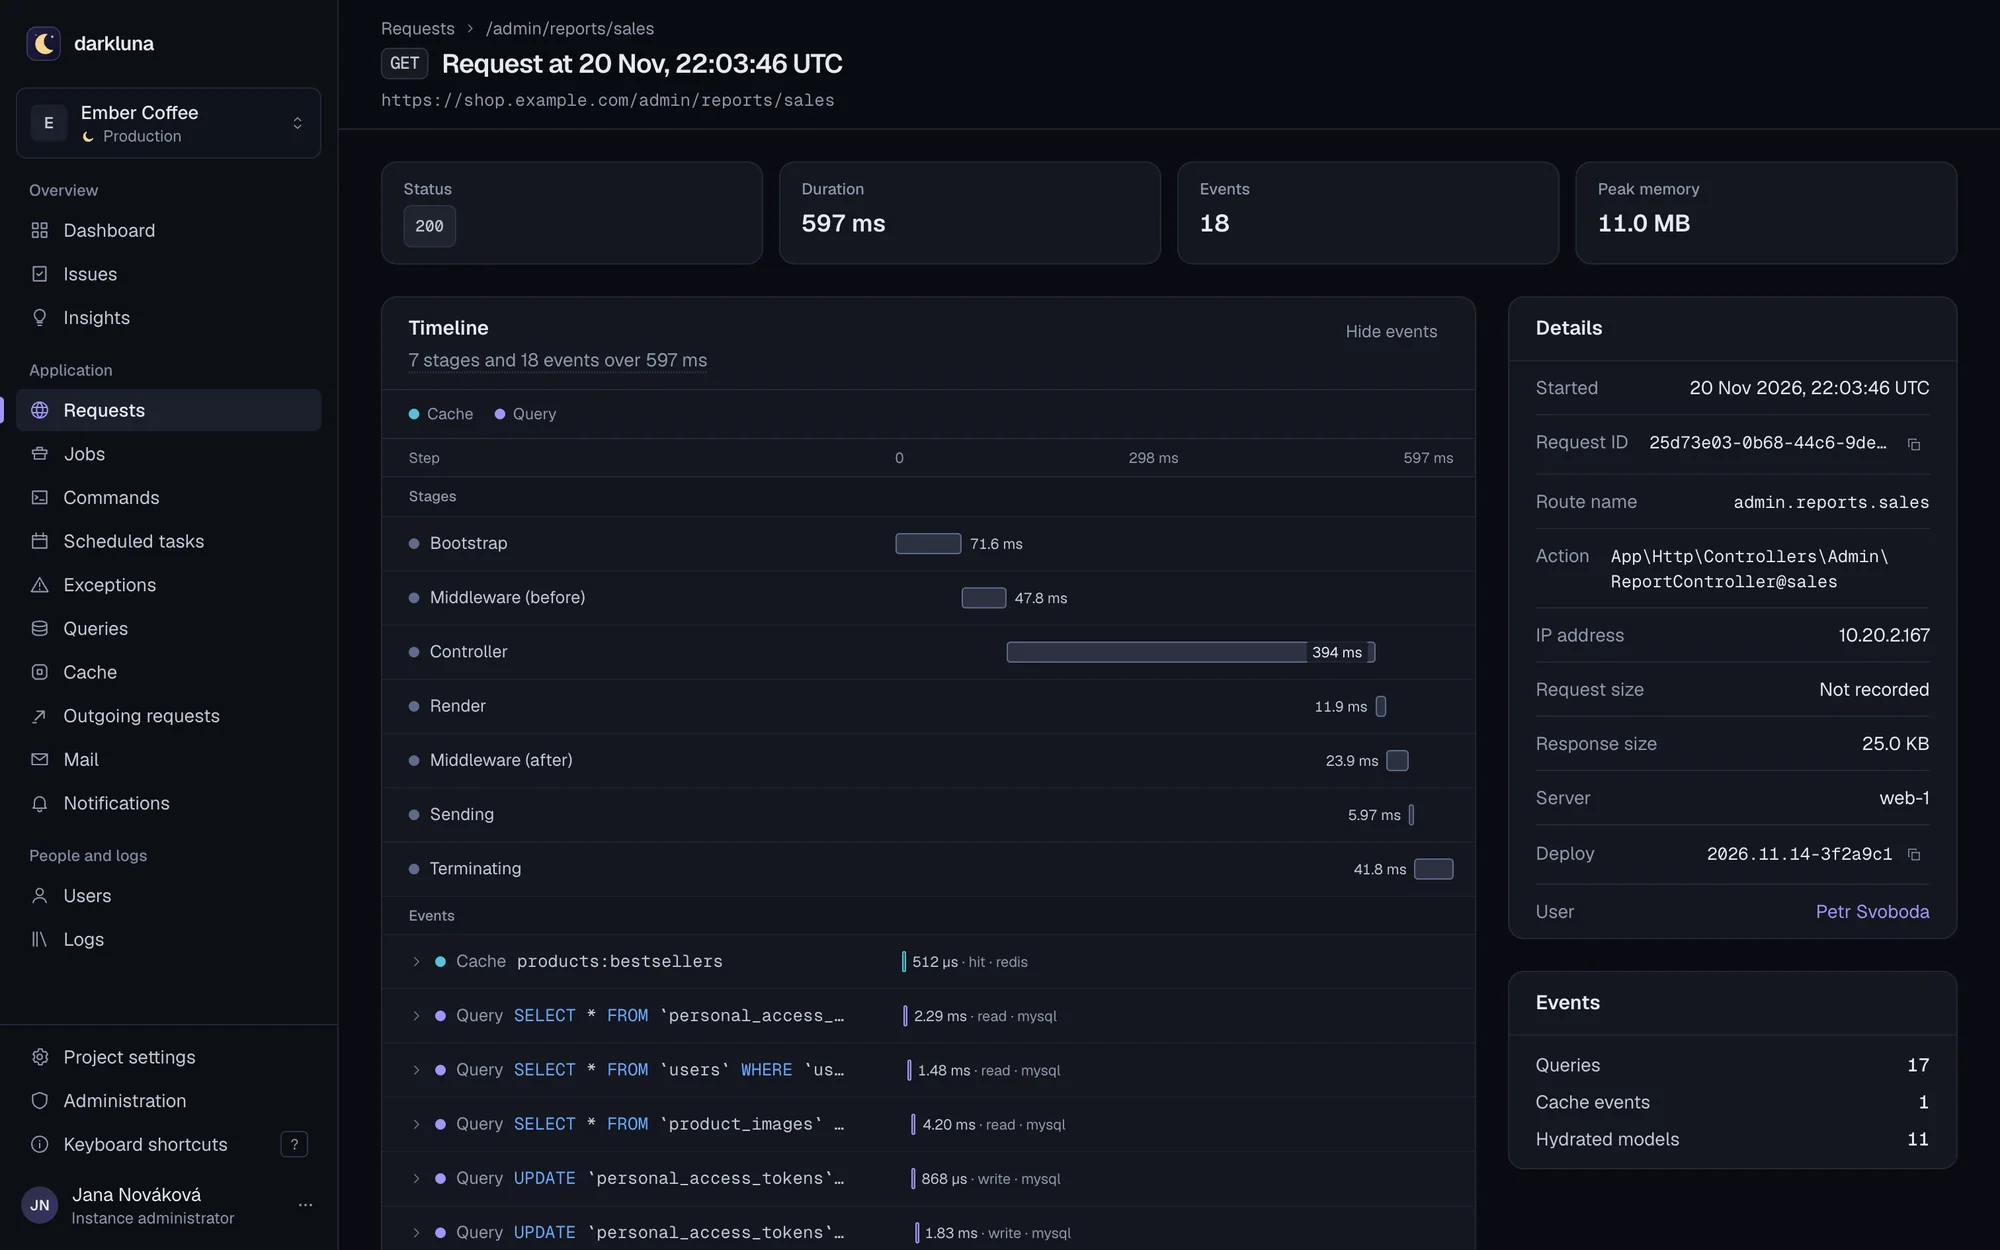
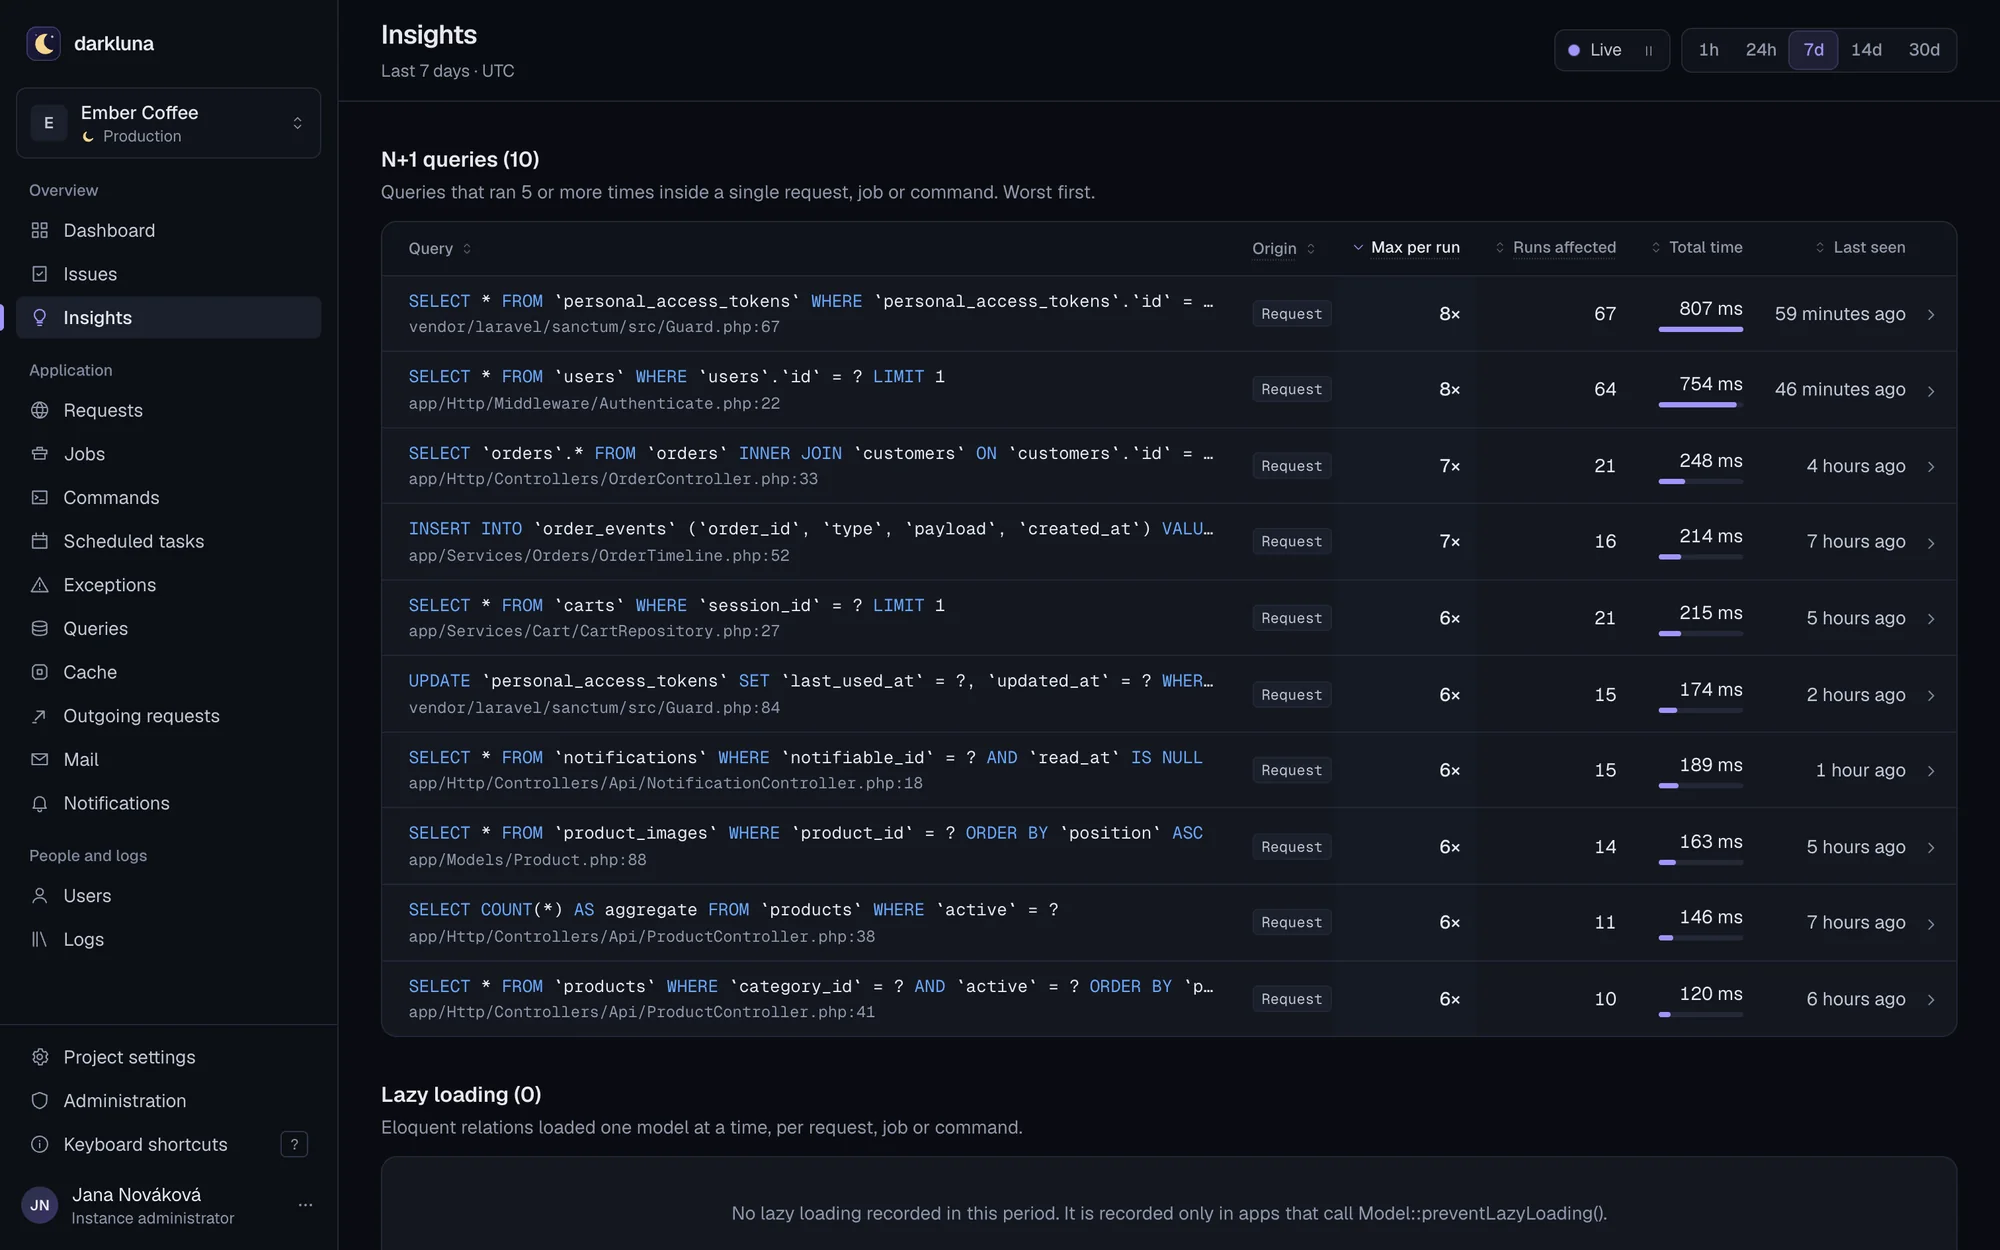
The backend is organised by domain, not by type: ingest, analytics, auth, meta storage, ClickHouse. No unwrap in a production path. Input is parsed into types at the edge. Every channel and buffer is bounded, so the process never falls over under load. On SIGTERM the buffers flush to ClickHouse before it exits.
- events per second at ingest, measured on a laptop
- 88k
- of memory for darkluna when idle
- 32 MB
- of disk for a week with a million events
- 75 MB
- container, plus ClickHouse
- 1